Barry Gilbert, Vice President, Asset Allocation Strategist
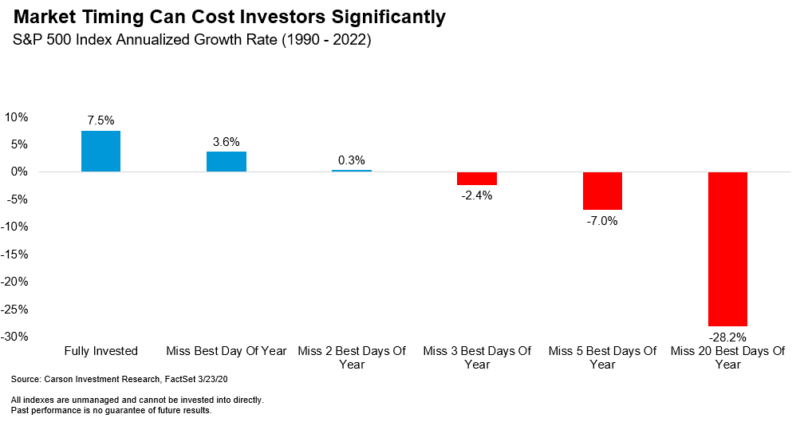
There is a commonly shared chart out there (with lots of slightly different variations) that has occasionally run into some criticism. The chart shows stock market returns if you missed the best market days each year. Carson’s version is below. The point of the chart is straightforward and is captured by the old market saw that “time in the market” is more important than “timing the market.” We learned this lesson again just recently, as some pundits flip from bearish to bullish nearly 10 months after the market bottom, discussed in Ryan Detrick’s August 17 blog, “Now They Turn Bullish?”. The thing is, this delayed reaction off of market bottoms is not that unusual, and despite the chart’s flaws, the consequences of missing the best days of the year is still one of the best ways of showing this.
Now we know that investors don’t jump constantly in and out of the market and even if they did, they would not be at risk of only missing the best one, two, or five days of the year. In that sense the critics are right. But the chart does still highlight the risks associated with market timing. It doesn’t take much of a mistake for the opportunity costs from being out of the market to add up very quickly. Mistakes like this can be so costly, that some industry studies estimate that over the long run they can remove as much as 2% per year or more from accumulated gains. (See, for example, these reports by Vanguard and Russell.)
And while many people believe they are, or could be, excellent market timers, the evidence is that not many are. To the contrary, what’s much more common is for people to be “anti-market timers,” the tendency to move out of the market when it would be more beneficial to move in, and vice versa. In fact, this common phenomenon is the source of Hall of Fame investor Warren Buffet’s famous advice, “be fearful when others are greedy, and greedy when others are fearful.” Sentiment is most negative and cash levels often surge when the market is near a bottom.

Stay on Top of Market Trends
The Carson Investment Research newsletter offers up-to-date market news, analysis and insights. Subscribe today!
"*" indicates required fields
What makes missing the best days (and some additional pretty good ones) easy is those best days often happen within shouting distance of some of the worst days. At the same time, investors who exited the market usually take some time to get back into it. Three of the 10 worst days for the S&P 500 Index since 1950 occurred in March 2020. Two of the best days came later in March.
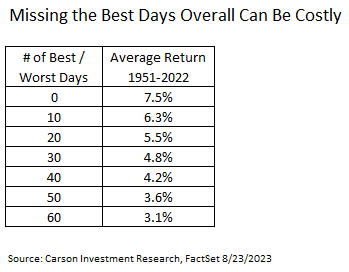
Since good days tend to cluster, often near or even among bad days, another way of looking at this is missing the best days over the entire period and not just so many days every year. So, take every market day from 1951 to 2022 and remove a certain number of best days. Even if you take out just 50, that’s an average of less than one day per year, the impact can be substantial.
Finally, what about missing longer best or worse periods? We looked at the best and worst one-month periods (21 trading days) since 1951. Looking at just the top 20 distinct one-month periods, the best are within three months of the worst 65% of the time and within a year 85% of the time. Moving out of the market near major declines substantially increases the odds of missing the best market days while still participating in much of the declines.
Of course, now is not the time that investors are raising cash. To the contrary, we see money moving back into the market. But it is a reminder of an important “lesson learned” that we only just experienced, which may help keep it in mind for the next market decline. Time in the market, not timing the market, is often what matters. And one of the best reminders of that lesson is probably still the chart that shows the consequences of missing the best days of each year.


