Why do we invest? Why do we hand over our hard-earned money – and advise others to do the same? We do so in hopes that we see a favorable return on investment. History tells us to be optimists. At our core, we as investors and advisors look to the future, not ignoring the risks, but focusing on the potential rewards. Despite negative headlines, despite partisanism, despite bulls and bears, we – historically speaking – have stuck with investing for the long run.
I am excited to say that this is my first blog since joining Carson Group after years of writing and podcasting at the highest levels of our industry. And one thing I will continue to do is stay true to in my process and approach by not distracting you or your clients from what really matters.
We aren’t going to get knocked around by the latest trends or over-inflated headlines. We aren’t going to be sensational or ignore relevant indicators. We are going to take the long-term view, while still focusing on the short-term implications.
Which brings us to today. What can we make of today’s market, and what is it potentially telling us about the future?
The big questions many investors are asking now is could this latest bounce be a bear market rally?
Is it something more? Is the bottom really in? These are all questions investors are asking after one of the worst starts to a year ever for stocks, but now a very impressive bounce off the June 16 lows for the S&P 500 Index.
The good news is it is looking more and more like the June 16 lows were likely the lows for the calendar year.
And there are two potentially very bullish developments to support this.
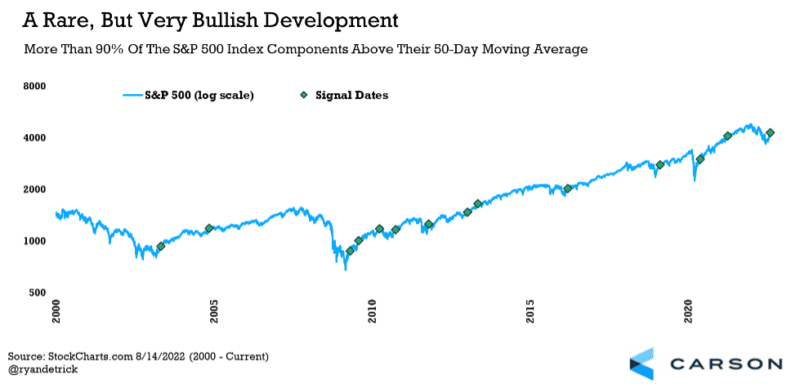
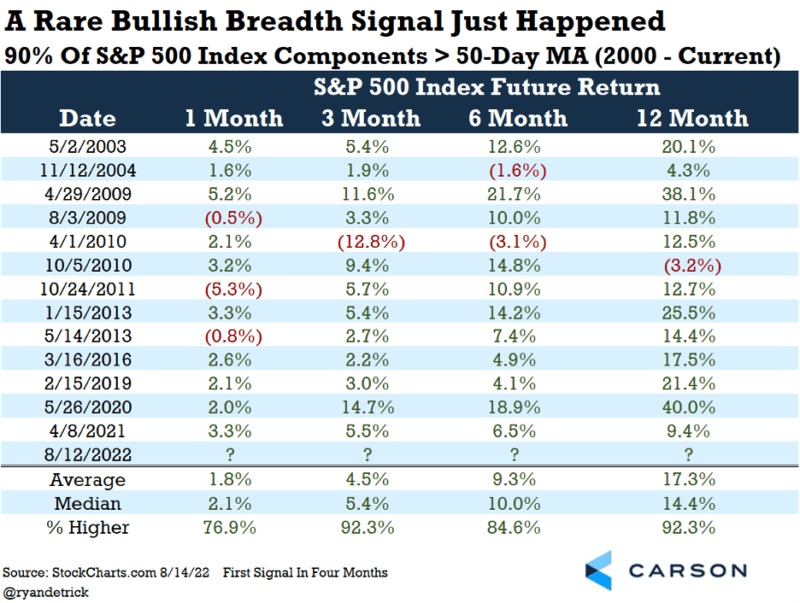
First, market breadth is simply how many stocks are going up and down. To see many stocks going up at once is a sign of strong breadth and is the hallmark of a healthy bull market. Well, last Friday a very rare signal suggested that continued equity strength was likely, as more than 90% of the components in the S&P 500 were above their 50-day moving average. This isn’t something you see in bear market rallies, but something that takes place in markets that have likely bottomed and are about to work their way higher.
As the chart below shows, these signals tend to take place in bullish trends.
Using data going back 20 years showed that strong returns going out were normal. Up more than 17% on average a year later and higher 92% of the time are both signs that the bulls indeed could have a lot to smile about going forward.
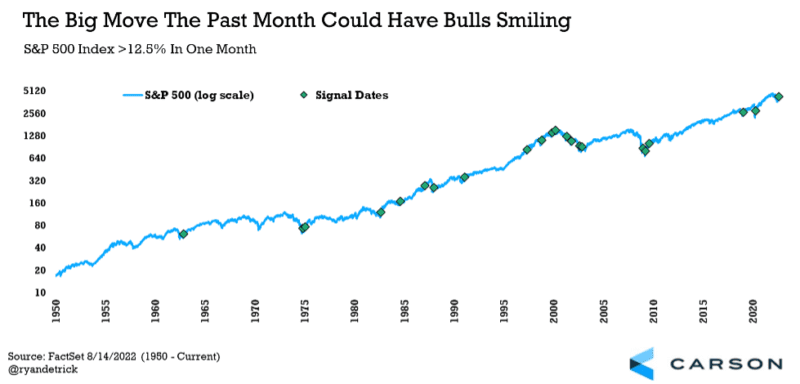
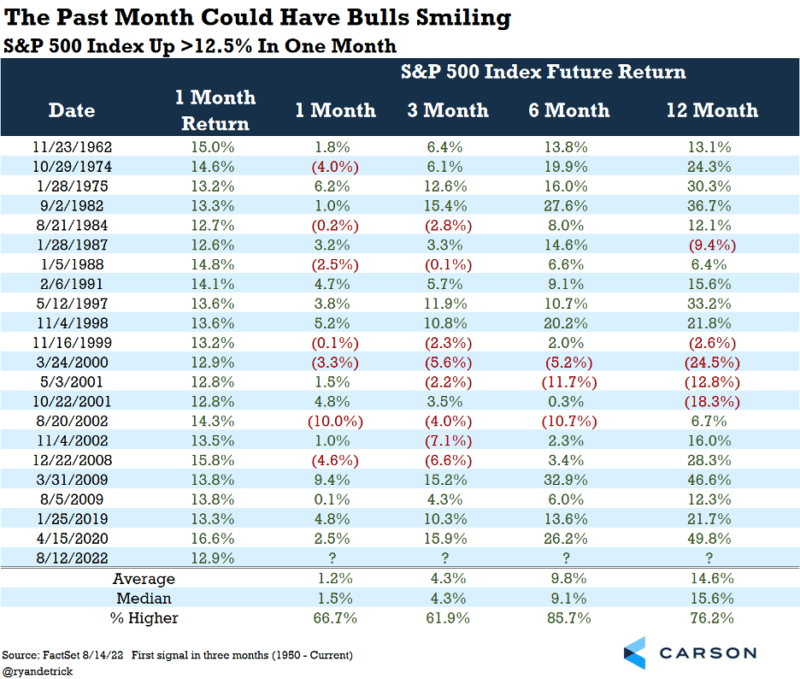
The second positive signal is the S&P 500 was up 12.9% in a month (21 trading days). This type of extreme strength is rare, but also potentially quite bullish. Looking at the chart below showed many of these best months ever took place near major lows or in the middle of bullish moves. Yes, there were many signals that didn’t work during the tech bubble implosion of the early 2000s, but most other signals over the past 60 years have been bullish signals.
Once again, looking at the returns after previous signals showed that continued higher prices was likely. Many investors think that a big move like we’ve just seen is a bearish signal, as stocks are likely to roll back over again, but that isn’t what history shows us. In fact, these big moves are often the initial thrust to eventual higher prices.
Please continue to read our new blog, as we examine the current macro and investment backdrop.


