TINA, or “There is No Alternative,” was the theme of the last decade as interest rates were close to zero. Yields on long-term bonds weren’t much above that. So, stocks were the “only alternative” if someone wanted reasonable returns.
But now it looks like there is an alternative, thanks to the Federal Reserve’s aggressive rate hikes. CREAM, or “Cash Rules Everything Around Me,” looks attractive enough to replace TINA.
Three-month treasury bills, which could be considered the best proxy for a liquid and “risk-free” asset, currently yield about 4.9%, while 10-year treasury notes yield around 4%. These yields are salivating, more so because we haven’t seen anything like it in 15 years.
Consider stocks on the other hand. And instead of dividend yields, let’s look at earnings yields. Earnings yields that are corrected for cyclical effects are a good predictor of long-run real returns for stocks (I’ll come back to the “real” part shortly). For example, if a company paid out all earnings as dividends, then the earnings yield would equal the dividend yield.
Earnings yield is basically the inverse of the Price to Earnings ratio. There are myriad approaches to estimating earnings, but let’s keep it simple. For example, if a stock trades at $100 and its expected earnings per share over the next 12 months is $5, it has a forward P/E ratio of 20. And an earnings yield of 5/100 = 5%. Meaning every dollar invested in the stock would “yield” 5 cents.
At the end of 2019, the S&P 500 was trading with a forward P/E of 18.5, i.e., with an earnings yield of 5.4%. Which was pretty good when you consider that 10-year treasuries were yielding about 1.7%. It implied an “equity risk premium” of about 3.4%— which is the excess return investors require to hold risky assets like stocks.
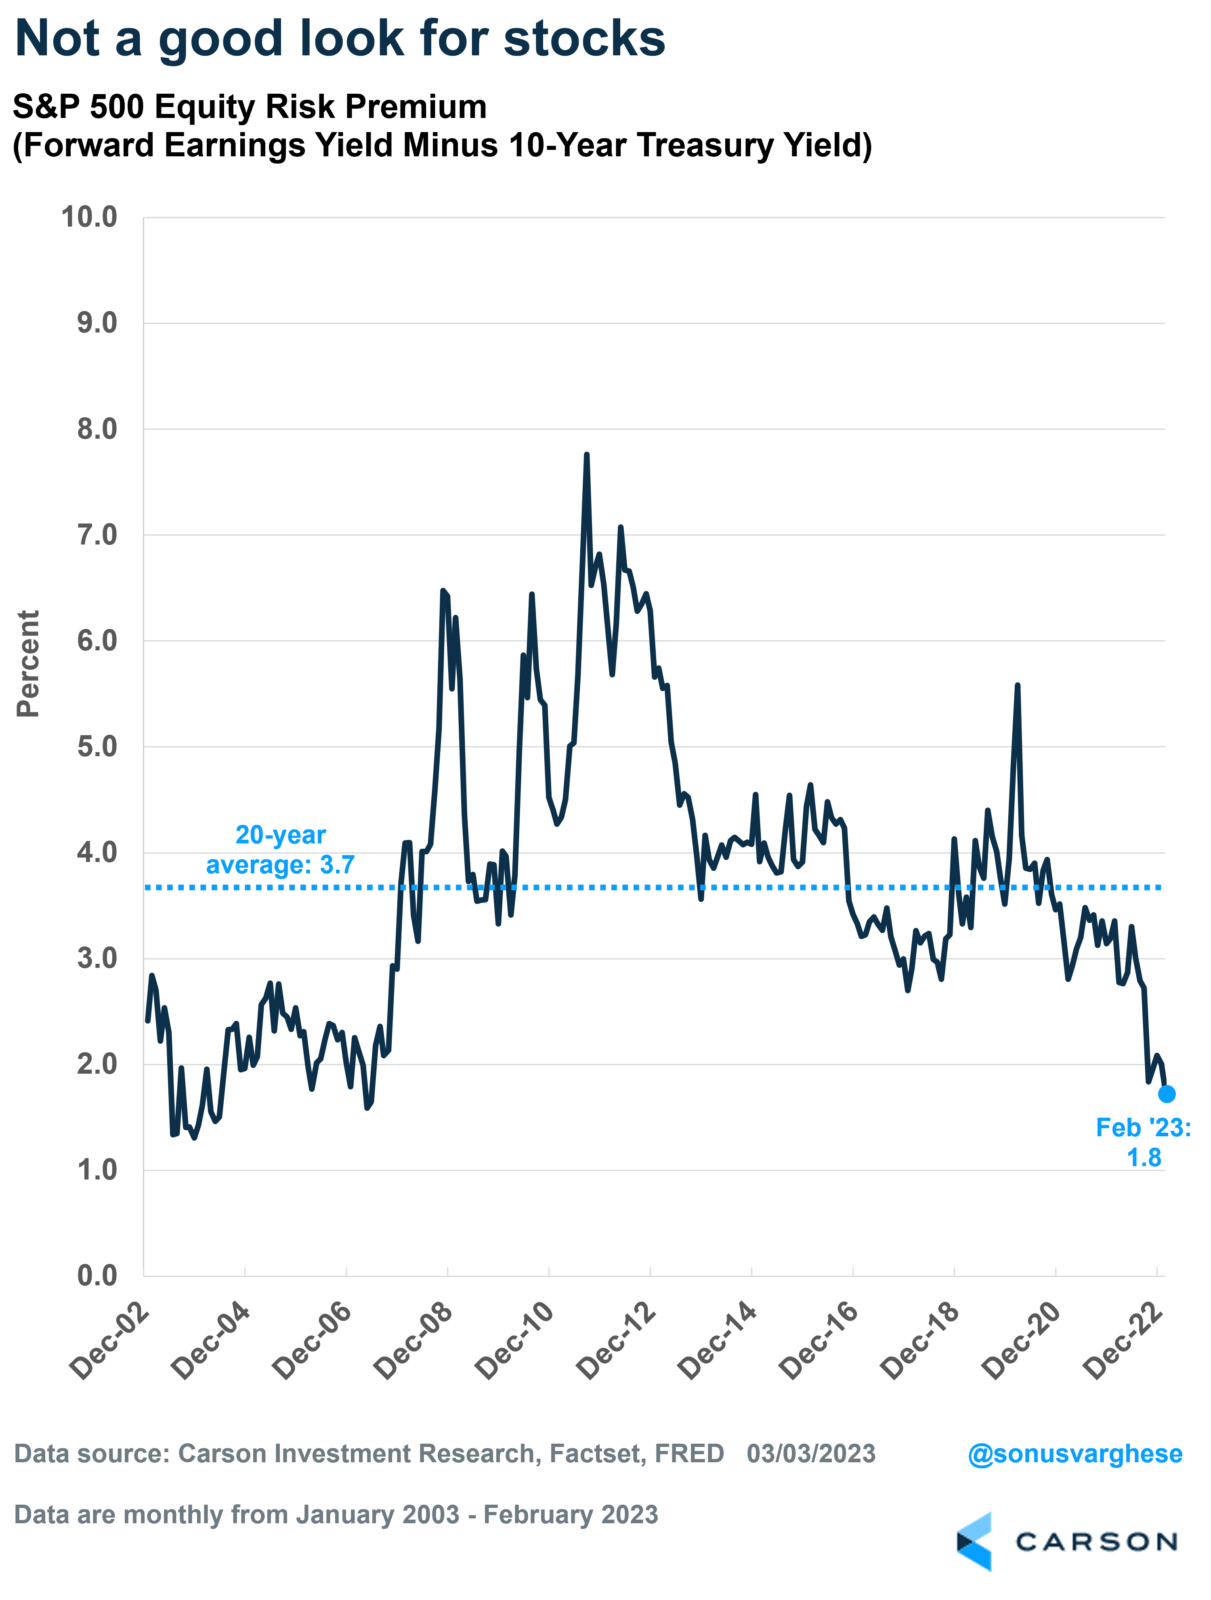
Right now, the S&P 500 is trading at a forward P/E of 17.5, which translates to an earnings yield of 5.7% and a tad better than the pre-pandemic yield. The problem is that with 10-year treasury yields around 4%, the implied equity risk premium (ERP) has seen a sharp compression, as shown in the chart below.
Which gets to the title of this piece: why should I invest in stocks when risk-free yields are as high as they are?
Not a great timing tool
For one thing, the ERP, as calculated above, is not a great indicator of future returns, let alone a timing tool that tells you when to hold stocks and when to shift to bonds. The last time the premium was as low as today was in June 2007, when it was 1.6%.
- Over the next ten years, bonds had an average annualized return of 4.5% versus 7.2% for the S&P 500— and that came despite a 50%+ pullback in 2008-2009!
- Over the next 15 years, bonds had an average annualized return of 3.3%, versus 8.5% for the S&P 500—and you had two massive pullbacks, in 2008-2009 and 2020.
In any case, this approach to calculating the ERP has its faults.
Stocks are real assets
One problem with the above approach for calculating the ERP is that stocks are real assets whose prices rise with inflation. Also, corporate earnings move higher with inflation since companies are able to pass along rising input costs over time to their customers. As Jeremy Schwartz at WisdomTree points out, this pricing power is evidenced by the fact that long-term earnings and dividend growth had outpaced inflation (even during the 1970s and 1980s when inflation was high). Cliff Asness at AQR makes the same case here, arguing that the appropriate comparison is earnings yield to real risk-free yields, as opposed to nominal yields.
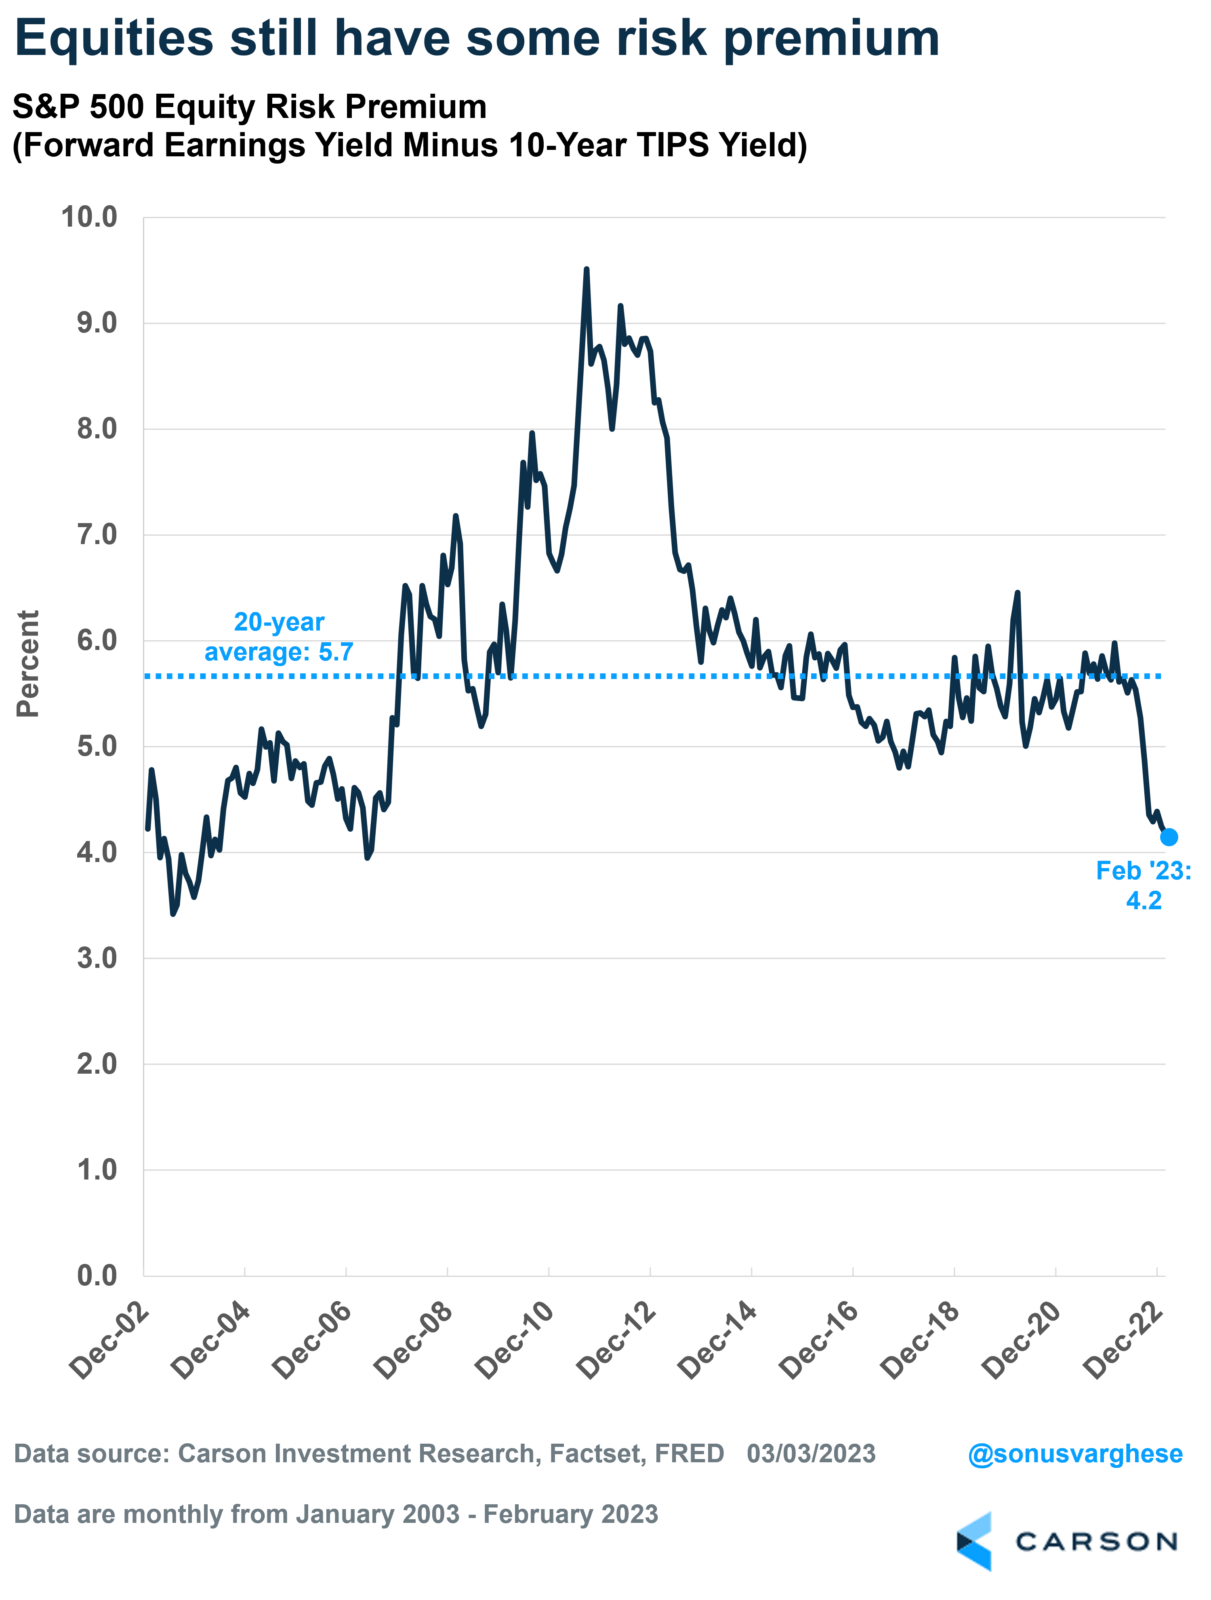
The picture looks a little better when you do that, though the ERP determined that using this approach is still lower than what it was pre-pandemic. That is because real risk-free yields, as measured by inflation-indexed treasury bonds, have climbed sharply since then. The 10-year real yield was close to zero at the end of 2019 and fell as low as -1.2% in August 2021. The Fed’s aggressive rate hikes resulted in a dramatic upward shift in 2022, with the 10-year real yield currently around 1.6%.
The chart below shows ERP estimated using real yields. It’s fallen to 4.2%, but that’s still some serious premium. Which is why we continue to overweight stocks over bonds for our long-term Carson House View allocations.
An even better alternative
So far, we’ve been looking at earnings yields and risk premiums for the broad stock market, as measured by the S&P 500. And as we saw, it may not be the greatest timing tool with respect to stocks vs. bonds. But it can help point you toward more attractive parts of the stock market.
Look one step below the broad stock market index, and there are some large variations. Especially if you separate value stocks from growth stocks.
Value stocks typically tend to have lower P/E ratios (and higher earnings yields) than growth stocks, which typically have high P/E ratios (and lower earnings yields).
When real yields were zero or negative, the relatively low earnings yield on growth stocks didn’t matter. Investors could bank on potentially high long-term earnings growth in the future.
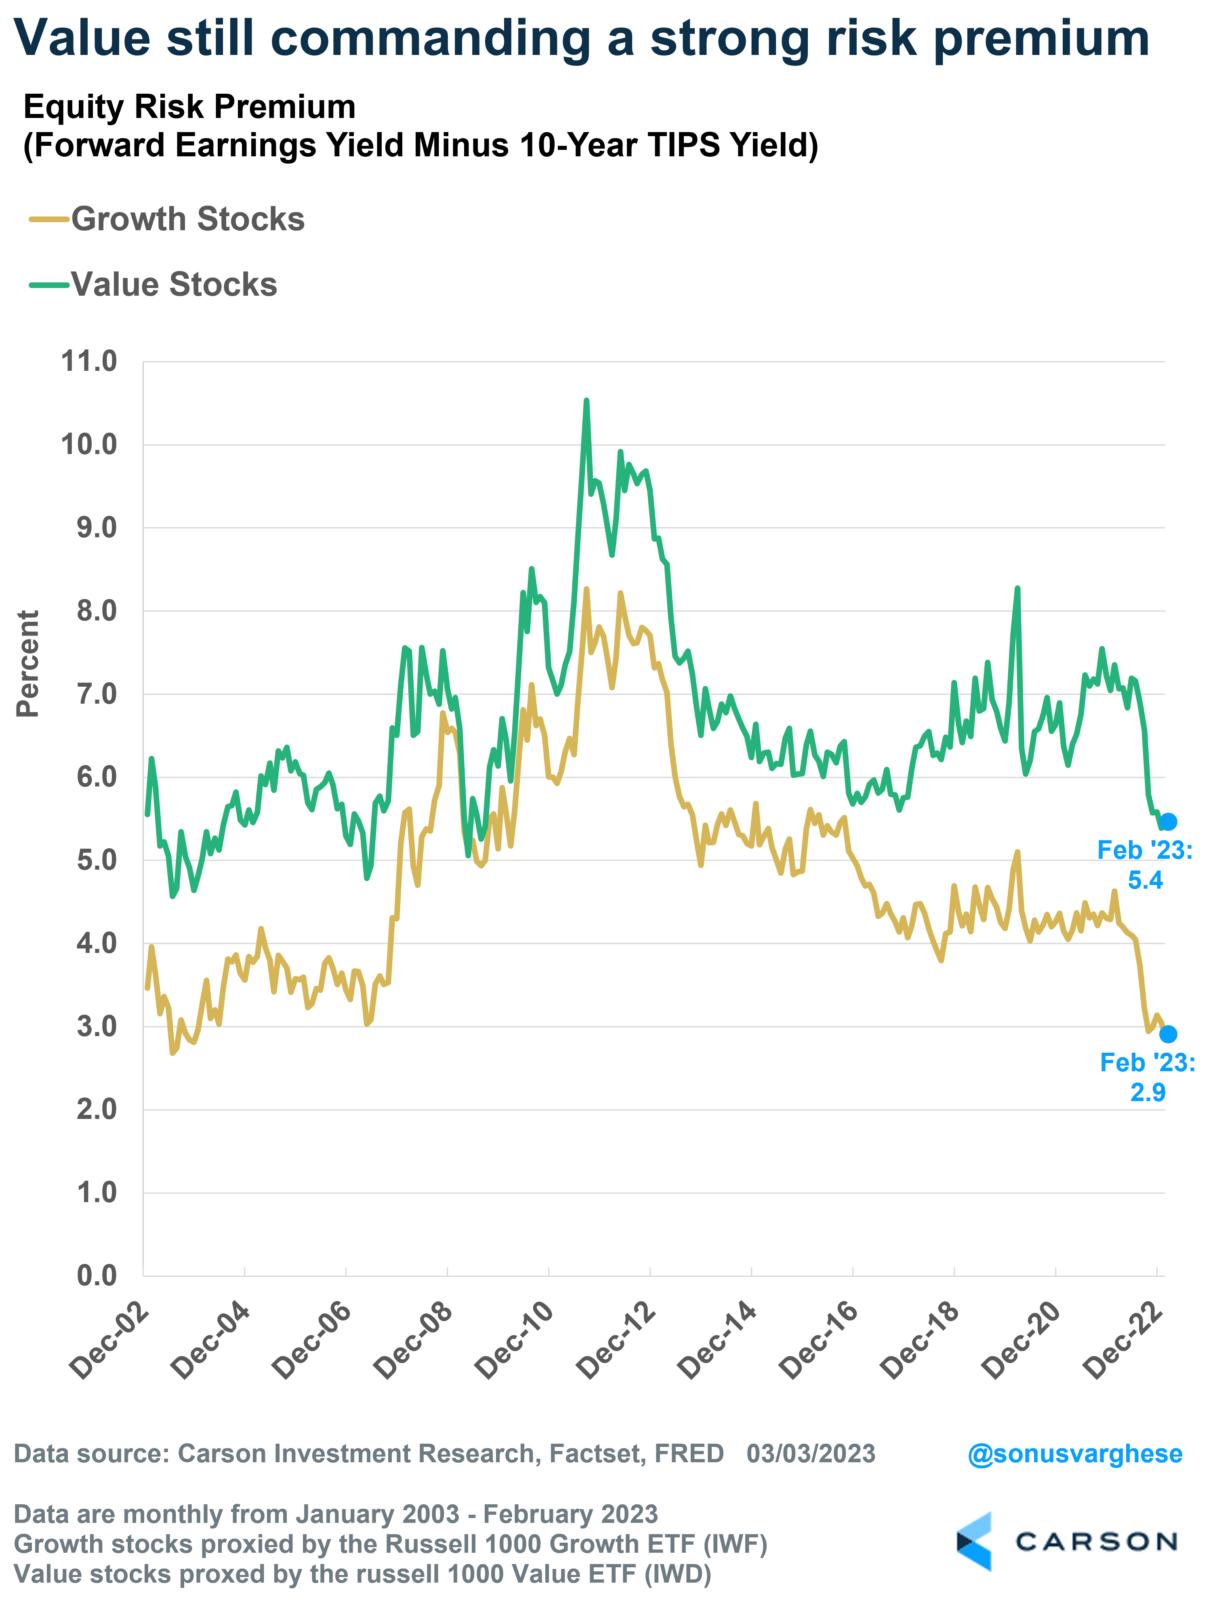
But the premium over real yields has shrunk dramatically over the past year as real rates rose. It’s currently at 2.9%, close to its 20-year low of 2.7%.
Contrast that to the risk premium for value stocks, which is currently at a relatively attractive level of 5.4%.
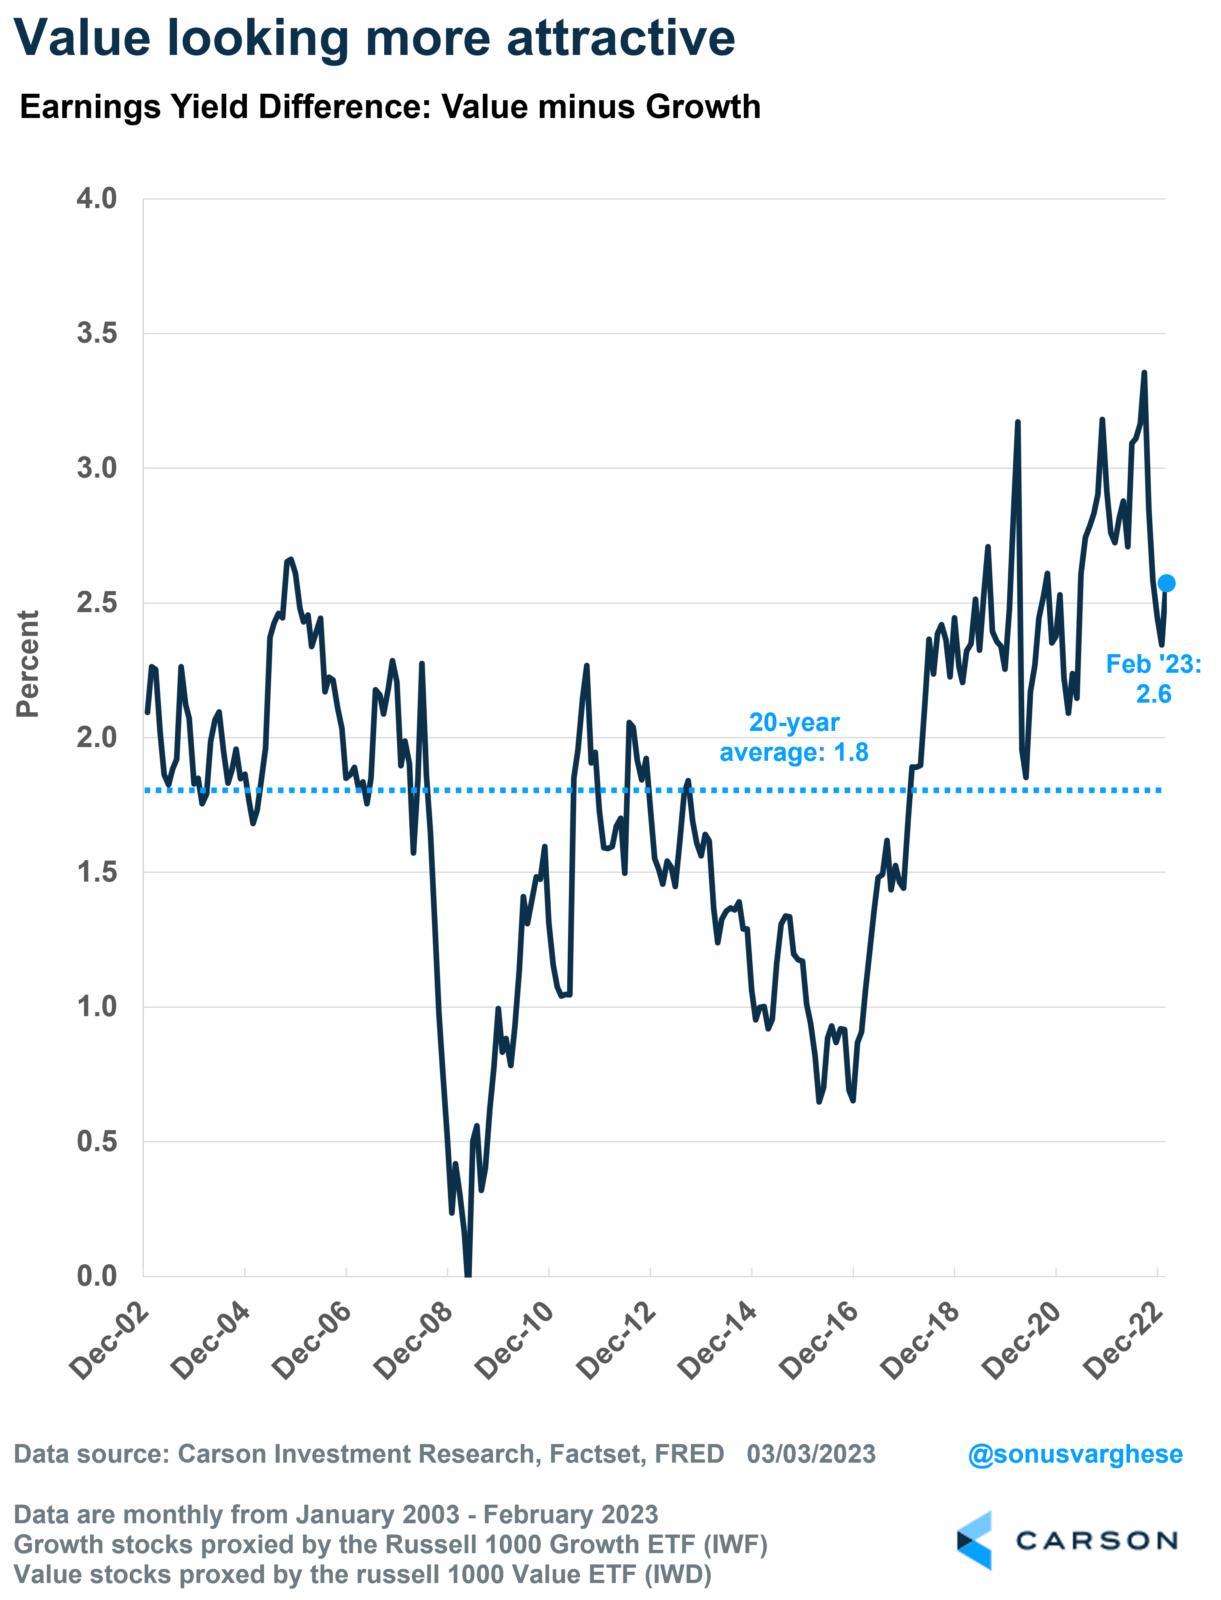
The chart below shows the difference between earnings yields of Value and Growth stocks. It’s currently at 2.6%, which is well above the 20-year average of 1.8%.
This is a big reason we are currently overweight value stocks in our Carson House View allocations.
Footnote: S&P 500 and bond returns are calculated via Factset using the S&P 500 Index and the Bloomberg US Aggregate Bond Index, respectively.


