“Wake me up when September ends.” -Green Day
Good riddance to what has been a very rough month for stocks. In fact, both August and September saw weakness, living up to their reputation as a potentially troublesome timeframe based on seasonality. Most might not remember it now, but the first half of 2023 was one of the best starts to a year ever for stocks. We classify this type of weakness as perfectly normal and likely necessary for stocks to catch their breath before a new surge higher.
Here’s the good news, seasonality has played out quite well the past year and if this continues, we predict a strong fourth quarter. Think about it, midterm years usually aren’t great for stocks, but they tend to see an October low. Then pre-election years tend to be strong, with most of those gains happening early. That sound familiar?

Stay on Top of Market Trends
The Carson Investment Research newsletter offers up-to-date market news, analysis and insights. Subscribe today!
"*" indicates required fields
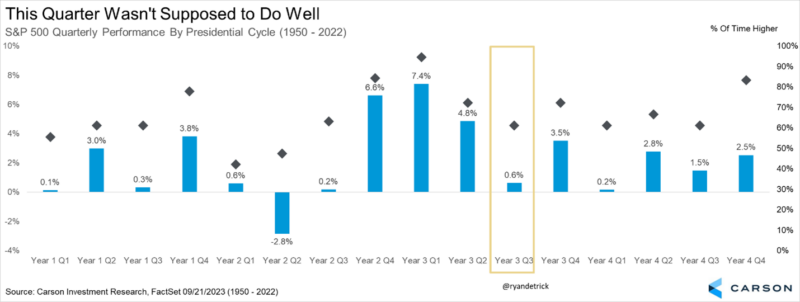
Here’s a chart we’ve been sharing for well over a year now and it showed that the past three quarters were supposed to be strong, and they were (up 7.1%, 7.0%, and 8.3%). This ran counter to nearly all the strategists on TV telling us that the first half of the year was going to be rough and the second half better. We took the other side, saying to expect strong gains in the first half of the year.
This brings us to now and the third quarter of a pre-election year wasn’t expected to do well and that sure played out again. Lastly, the fourth quarter of a pre-election year usually bounces back, something we expect to happen this year.
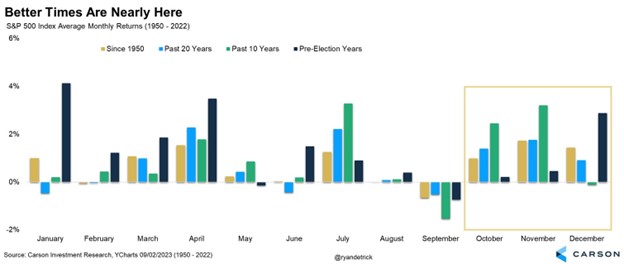
Breaking it down by months, the upcoming three months tend to be quite strong. October is known as a month for extreme volatility (think 1987 and 2008), but it is usually a pretty decent month overall, with November and December historically very strong.
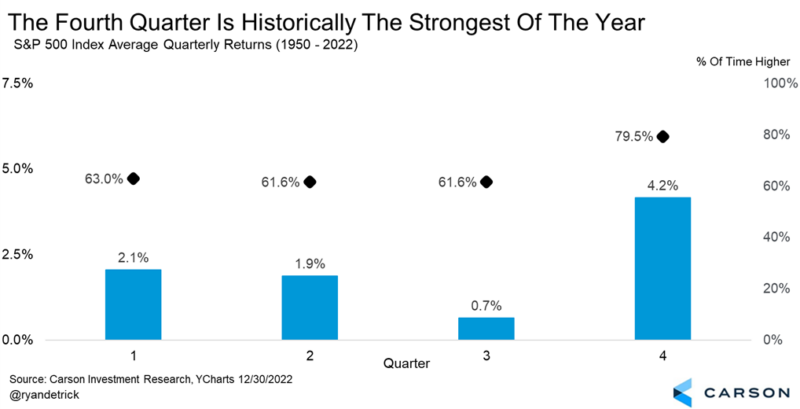
As most investors know, but is important to remember, the fourth quarter is the best quarter of the year, up nearly 80% of the time and up more than four percent on average, twice as much as the next best quarter.
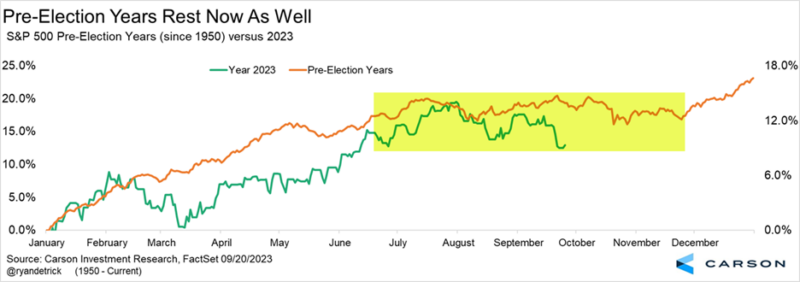
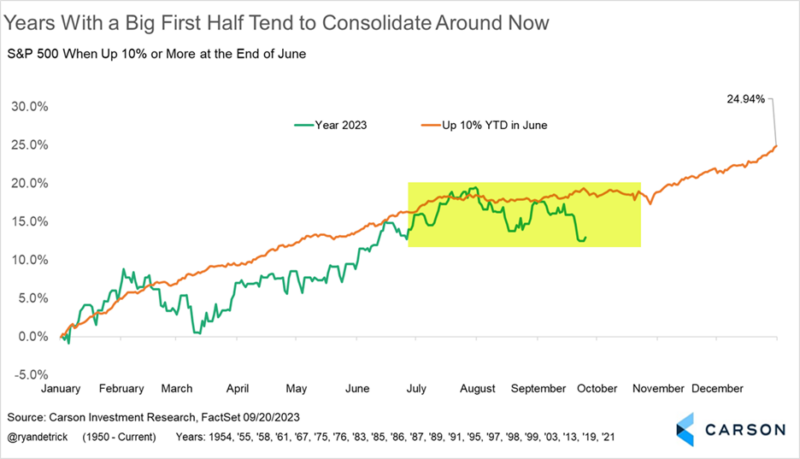
The next two charts tell similar stories that it is perfectly normal to see chop and weakness right now. Below we share the average pre-election year for the S&P 500 and years that are up more than 10% the first six months of the year. The good news is it would be perfectly normal to see strength and new highs to end the year, something we expect to happen again.
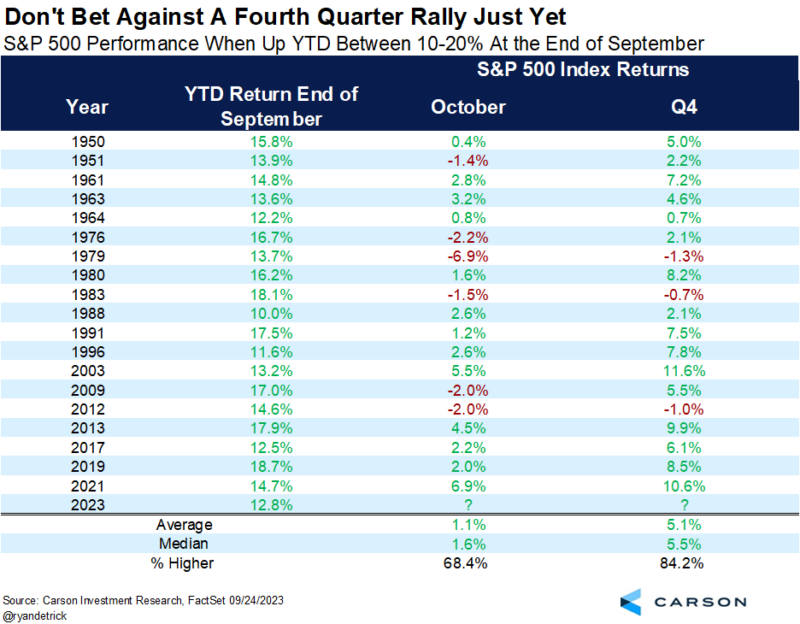
Here are two more examples of why we see a late-year rally.
When the S&P 500 is up between 10-20% for the year heading into the normally strong fourth quarter, then we can expect an even better fourth quarter, up more than 5% on average and higher more than 84% of the time. In other words, a strong year tends to end strongly.
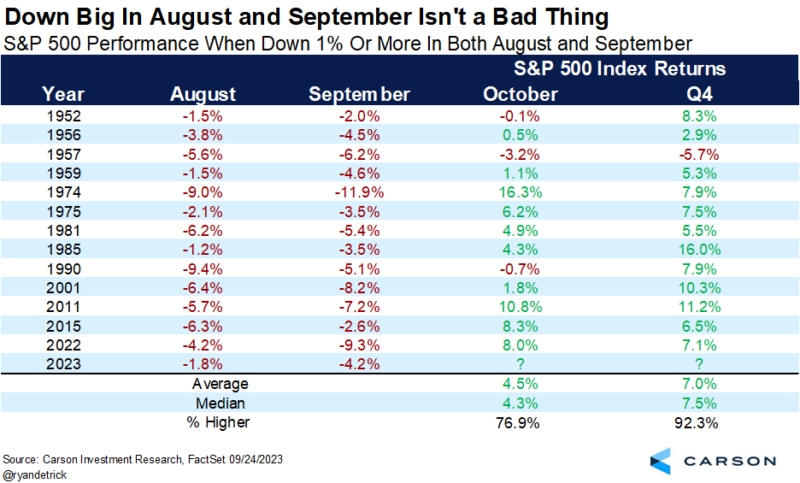
Adding to reasons to look for a rally, when stocks fall more than 1% in both August and September, a big bounce back in October is normal, as is a great fourth quarter. The last three times that happened, October bounced back a very impressive gain of 10.8%, 8.3%, and 8.0%, respectively. Turning to the fourth quarter, it has been up 12 out of 13 times and up more than 7.0% on average. In other words, when we see the seasonal August/September weakness it is also normal to see a strong end-of-year rally.
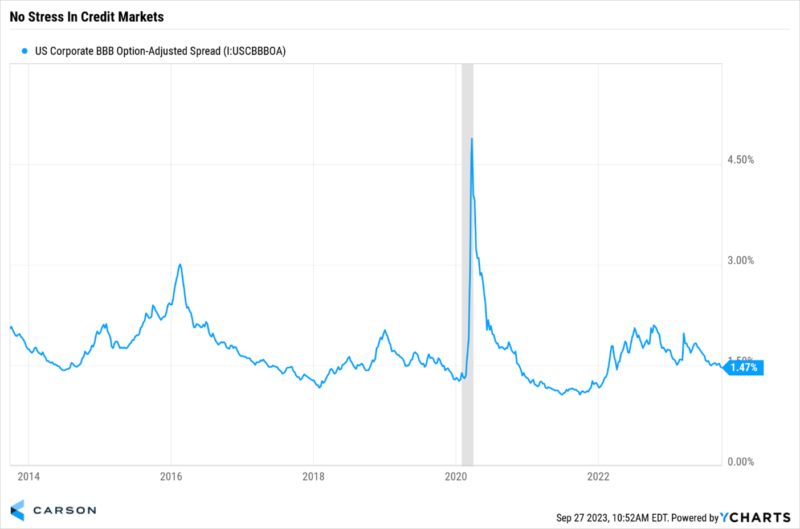
I will leave with this; the credit markets aren’t showing any stress in the system. To keep this simple, if the riskiest companies were in trouble, then we’d expect spreads to be higher, as investors would be worried about being paid back. If you don’t expect to be paid back on a company’s debt, then you’d charge more. Well, looking at BBB spreads shows a somewhat shocking situation, as the spreads are hitting their lowest level of the year currently. To us, this is another clue that the recent weakness isn’t a new monster under the bed, but more normal seasonal weakness after a great start to a year.
For more on this, here’s a hit I did with Frank Holland this morning on CNBC.
1917514-0923-A


