“Who you gonna believe, me or your own eyes?” Groucho Marx
Nearly right on cue, stocks have had a rough August. We noted at the start of the month that the odds were high for some type of seasonal weakness, coupled with many of the longtime bears suddenly changing their tunes. The good news is we don’t think this is the end of the world, but more a normal time for stocks to simply catch their breath.
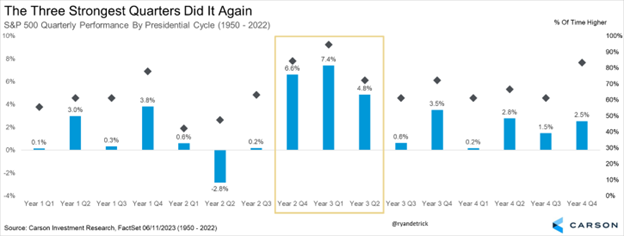
I’ve shared this chart a bunch this year, so I might as well do it one more time. It shouldn’t have been a shock that stocks did as well as they did the three quarters ending in June, as those were the three best quarters out of the entire 4-year Presidential cycle. Sure enough, the third quarter of pre-election years has tended to be weak, but the fourth quarter, still ahead of us, has done well. This is how we see things playing out again, with likely new highs happening, but it might take more time and consolidation first.
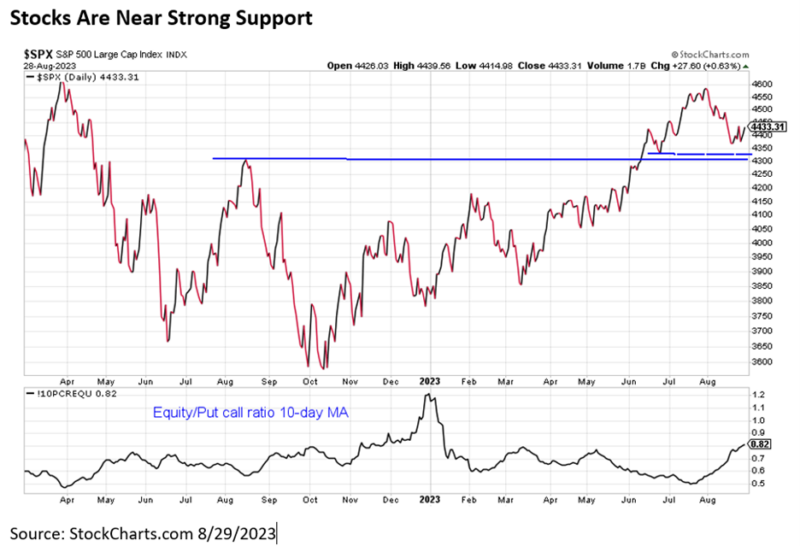
We had an 8% pullback back in March during the regional bank crisis and just missed a 5% minor pullback recently. Maybe we do go on to break the recent lows and officially tag a 5% minor pullback or a little more, but the good news is there is major support just beneath current levels.
As the chart below shows, the June lows are near 4,328, while the peak from last August is around 4,300. Those two areas should act as strong support and we don’t expect them to be violated. Additionally, at the bottom panel of the chart we show the 10-day moving average of the CBOE Equity Put/Call Ratio moving to its highest level this year. This is a sign that the market is getting worried, exactly what is needed to flush out the weak hands.
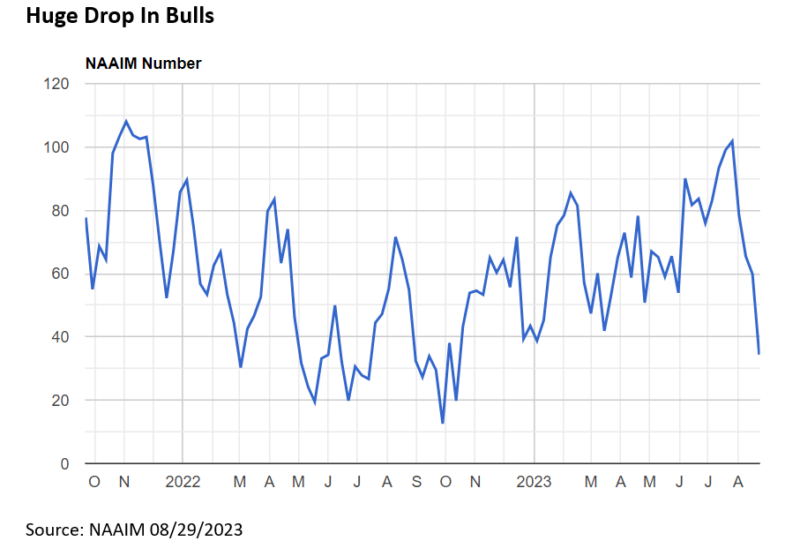
There are other signs that with the August swoon, some worry has been entering the picture. The NAAIM Exposure Index represents the average exposure to US equity markets from investment managers. Sure enough, they’ve gone from wildly bullish late last month to quite worried near the end of this month.
To put things in perspective, this was above 100 at the end of July for the first time since late 2021, right before the vicious bear market of 2022. Now four weeks later it has fallen to the lowest level this year, down 67 points in four weeks. The only time in history to see a larger four-week drop? March of 2020 and the COVID crash.
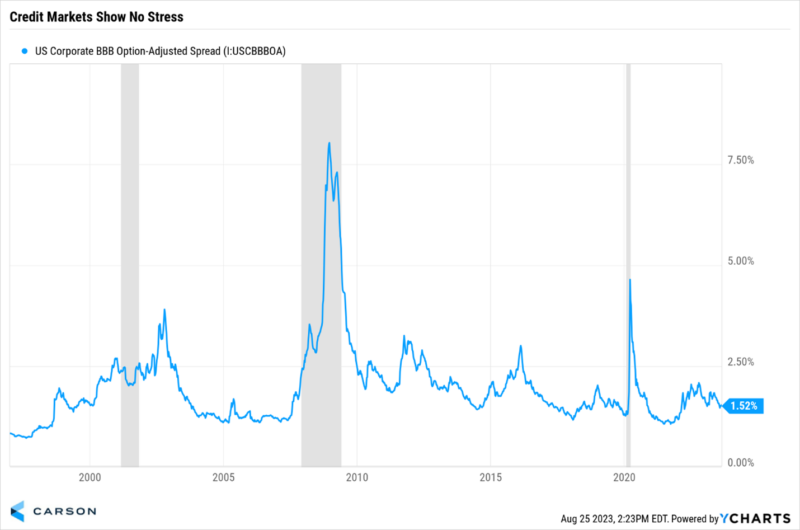
Lastly, credit spreads tell us how much extra interest over Treasury rates investors are demanding from companies that want to borrow money — if investors believe a recession is imminent, they may expect lending to companies to be more risky and hence demand higher interest rates. In other words, if there was a monster under the bed the credit markets would likely show it. Go read that quote from Groucho Marx at the top one more time. I grew up being told that is was wise to listen to the credit markets. You might hear some economist on TV with a bowtie telling you the end is near, but if the credit markets aren’t worried, I’m not worried.

Stay on Top of Market Trends
The Carson Investment Research newsletter offers up-to-date market news, analysis and insights. Subscribe today!
"*" indicates required fields
The chart below shows that during past recessions spreads have soared, but they remain quite tight currently. We think credit markets have some of the smartest investors in the room, and if they aren’t worried, the weakness in the market likely won’t get much worse and may offer an opportunity to add to equities.
So there you have it, stocks have pulled back in August and fear has increased. These were things we’ve been talking about and expecting for weeks. We still have the tricky month of September ahead of us, but with credit markets showing very little stress, we don’t expect a major stock meltdown like so many on TV keep predicting. Instead, we remain overweight equities and do expect stocks to make new highs before the year is done, it just might take a little more consolidation first.


