“October: This is one of the peculiarly dangerous months to speculate in stocks. The others are July, January, September, April, November, May, March, June, December, August and February.” Mark Twain
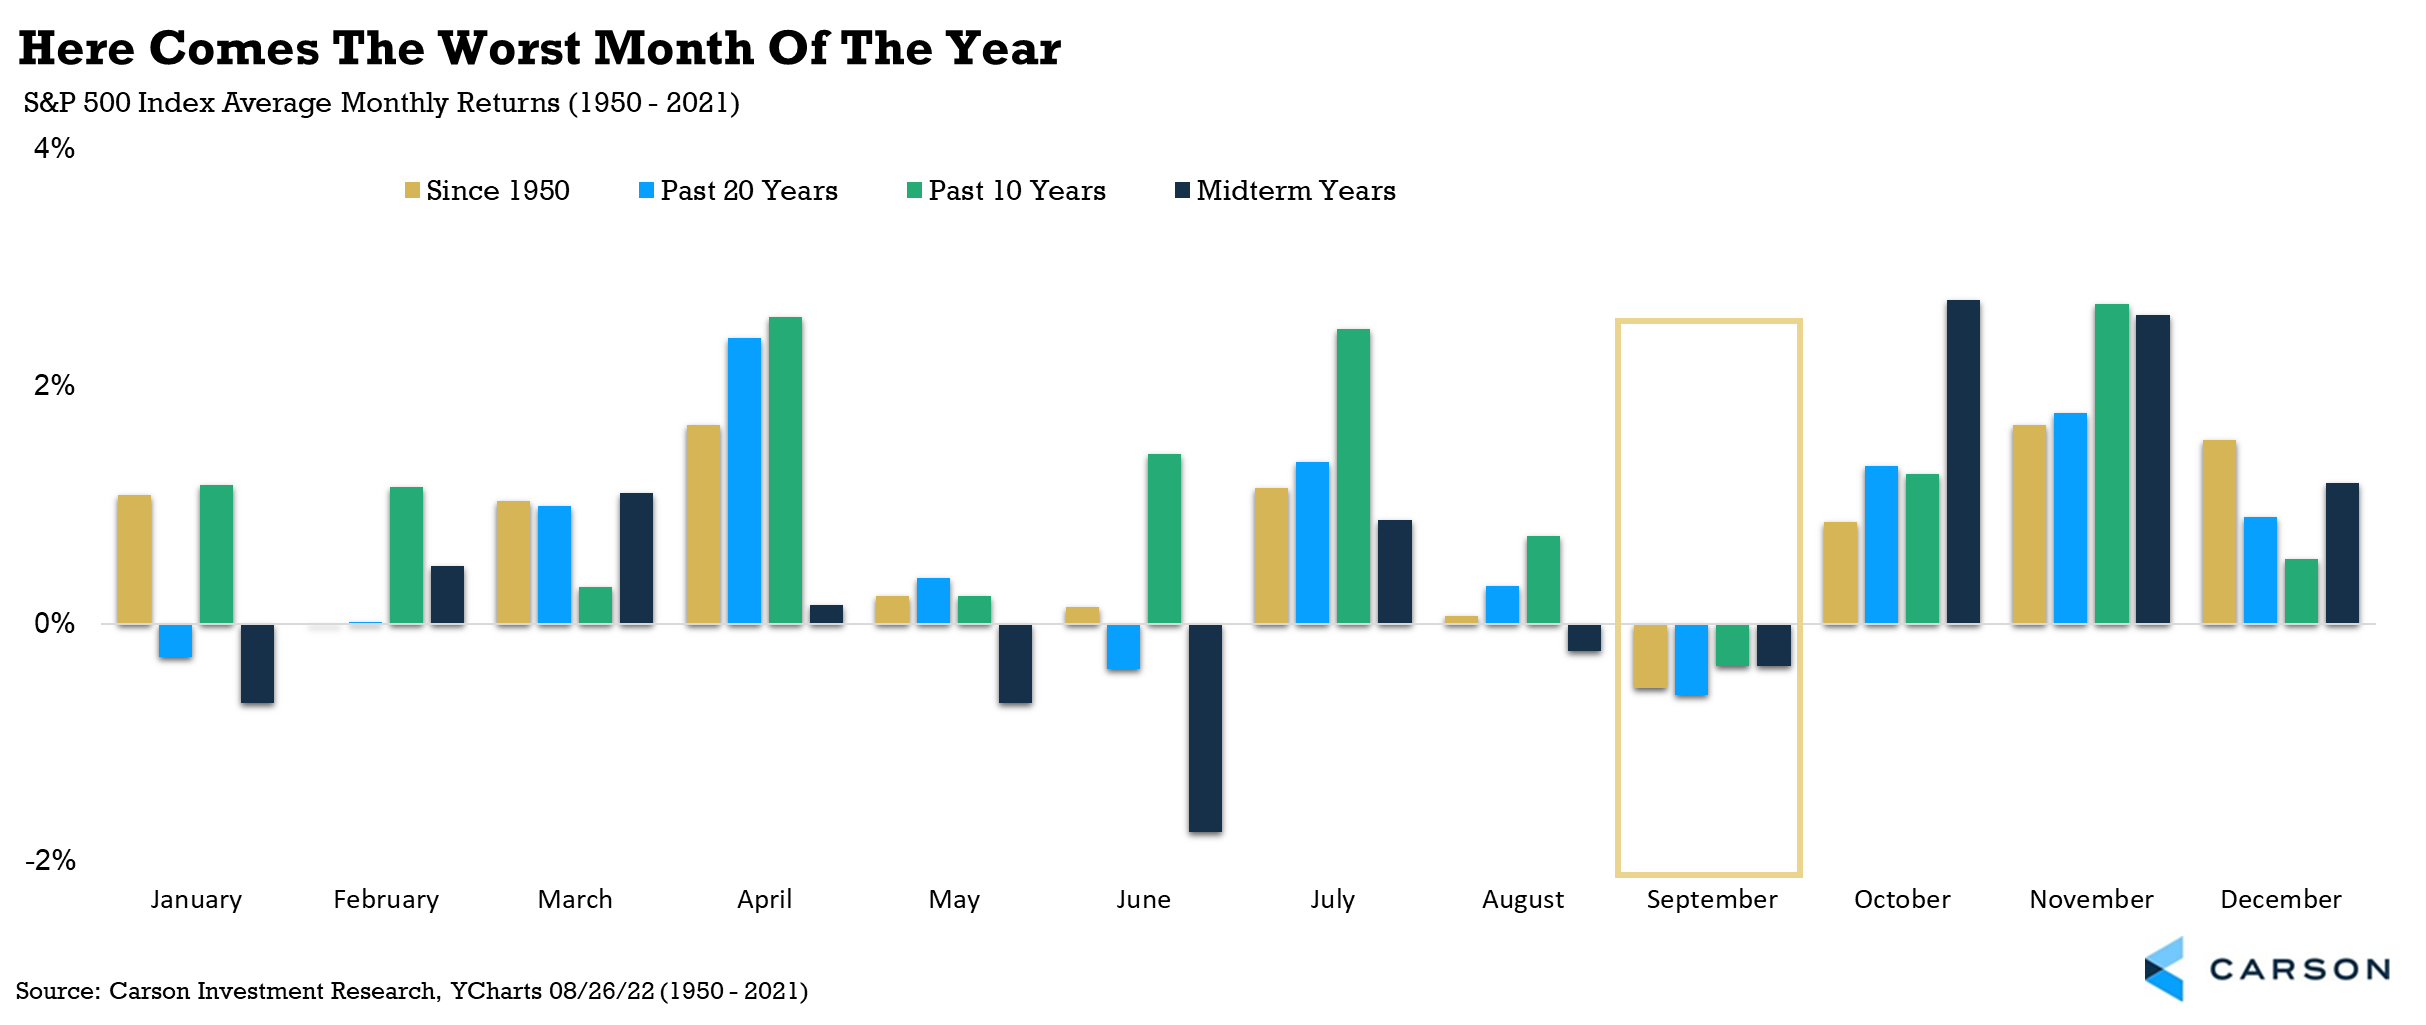
Although October is known for some spectacular crashes, it is September that historically has been the worst month of the year for stocks, suggesting Mr. Twain should maybe change his famous stock market quote. In fact, as our first of four charts show, since 1950, the S&P 500 lost 0.5% on average in September, making it the worst month of the year. It’s also been the worst month over the past 10 and 20 years.
Why is it so weak you ask? The two ideas that make the most sense to me is first, the big boys are back from the Hamptons and begin to sell to square up their books. Secondly, many large hedge funds and institutions end their fiscal years in October and you tend to see some selling ahead of year-end. Of course, I’d like to ask why October isn’t weak if this is the case, but I digress. Whatever the exact reason, we just think it is important for investors to be aware of this potentially tricky month.
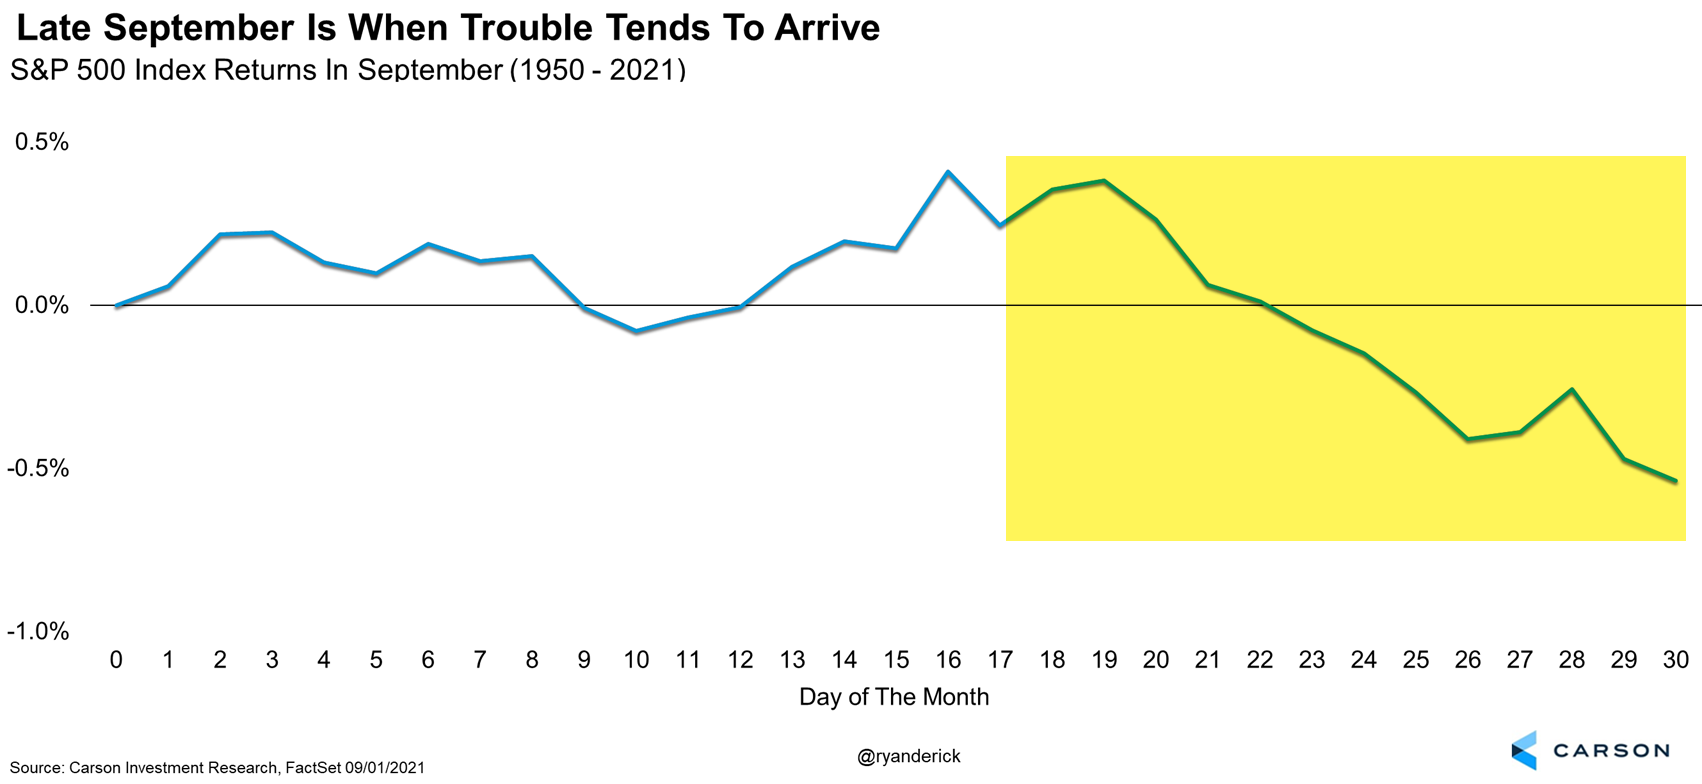
The next chart is something that most investors might not know. Most of the weakness historically takes place later in the month, while the first half is fairly strong.
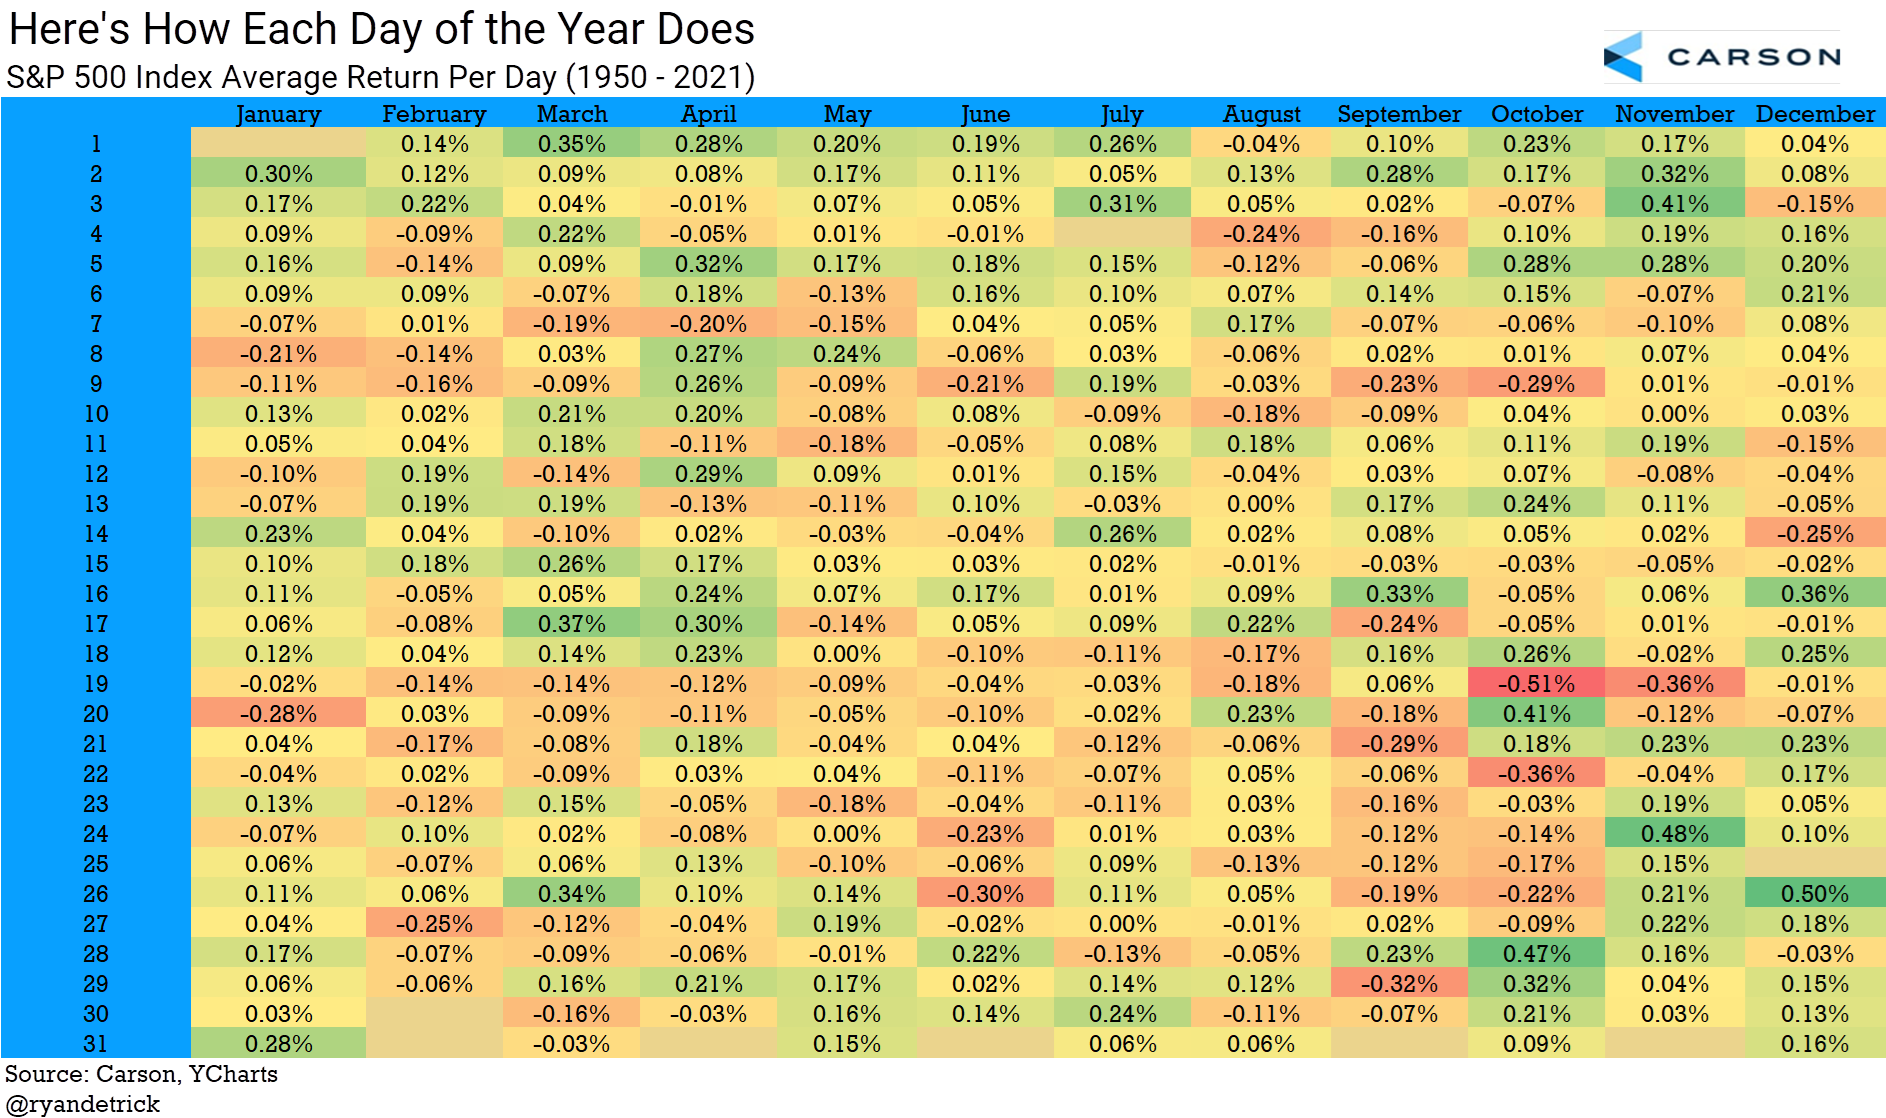
Our next chart (or technically a table, but you know what I mean) is always a popular one, as it shows how each day of the year historically has done. This once again shows later in September is one of the worst times of the year. I’d like to note that my birthday is October 28, which until only recently had been the best day of the year. I’m not sure that’s a coincidence and I look forward to it taking back the number one spot soon.
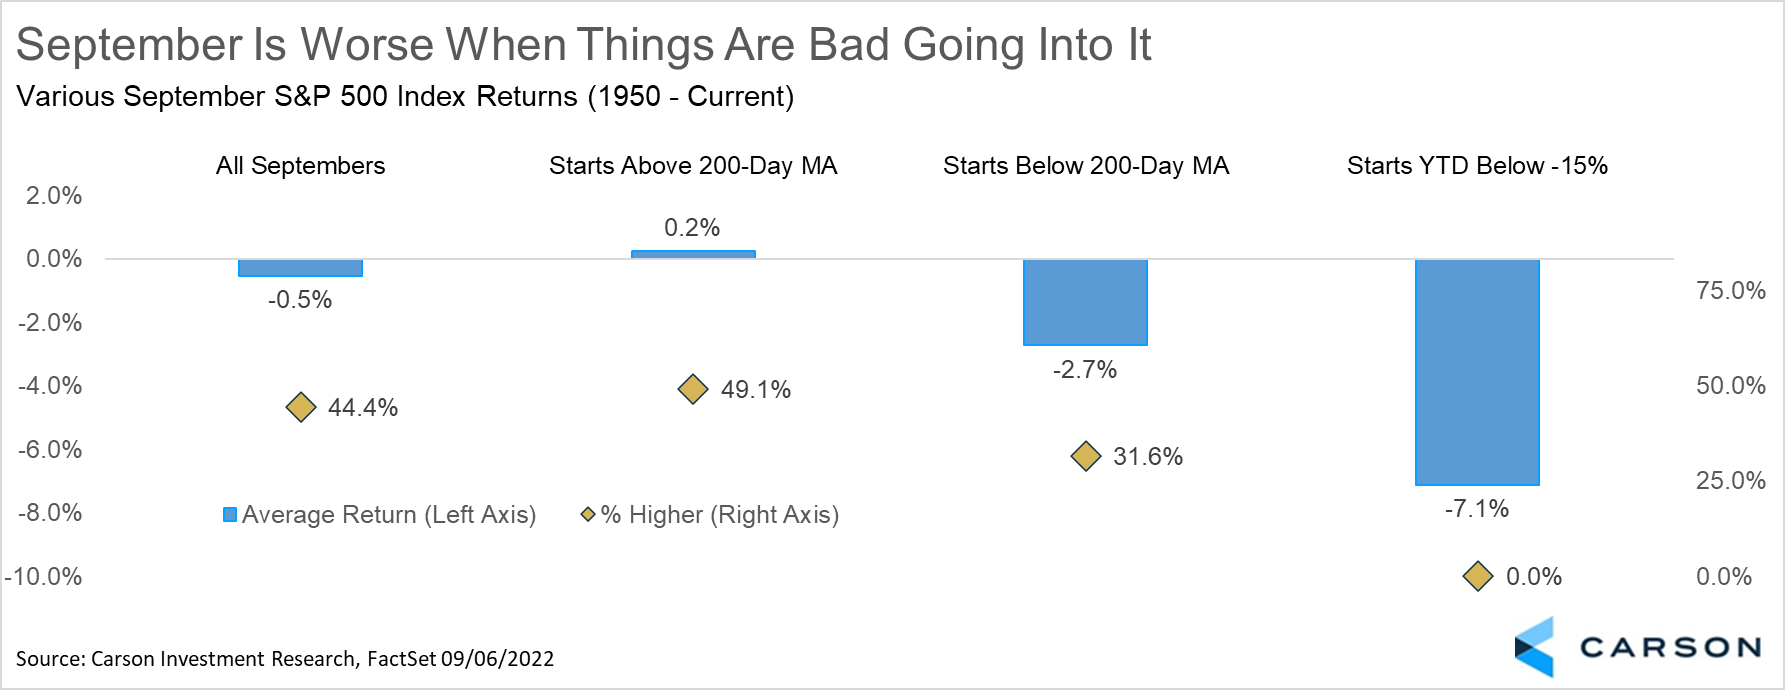
Finally, this last chart shows that if stocks are weak heading into September, things can get even worse. As you can see, the average September drops 0.5% on average, but sports a slight gain if it starts the month above the longer-term 200-day moving average. The catch is things get worse when it starts beneath the 200-day moving average or down more than 15% year-to-date. Given 2022 started September down 17% year-to-date and beneath the 200-day moving average, the potential for seasonal weakness is quite high.
The good news is we do think the lows for the year are likely in, but it won’t be a smooth ride and we’d advise investors to be ready for some bumps over the coming weeks. Please continue to read our blog, as the Carson Investment Team breaks it all down for you.


